June nonfarm payrolls declined by (- 125,000). Of that, (- 225,000) was laid off census workers, meaning that hiring for the month of June totalled +100,000 workers. This is the sixth straight month of payroll growth ex-census. Since employment bottomed at the end of last year, 593,000 private sector jobs have been added
The above number is the "establishment survey" which is obtained by calling businesses, and is subject to the controversial "birth/death" adjustment. The separate "household survey" which is obtained by calling households -- which does NOT included any birth/death adjustment (and is a much more noisy number) showed a -gain of 191,000 jobs- loss of 301,000 jobs. This year, the household survey shows a gain of 1,300,000 jobs in the economy.
The headline unemployment rate, which is also obtained by the household survey, declined to 9.5% The more inclusive U6 rte, which includes the underemployed, also fell to 16.5%.
More details below the fold.
Here is the graph of nonfarm payrolls (including census jobs):
Image may be NSFW.
Clik here to view.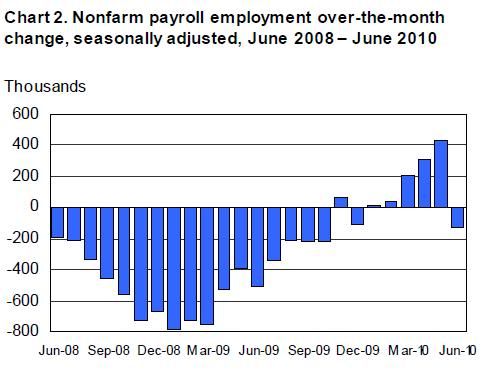
and here is the unemployment rate:
Image may be NSFW.
Clik here to view.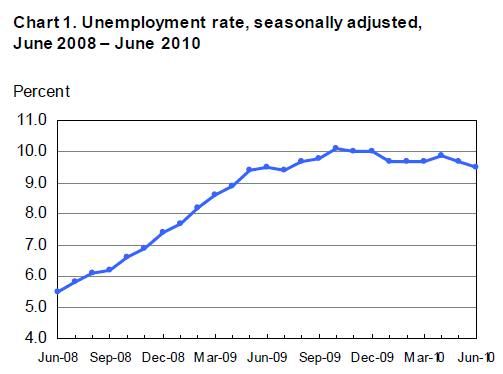
In addition to the headline number, April and May's results were both revised upward by a total of 25,000 jobs. Since the bottom in December, 700,000 non-census jobs have been added to the economy.
- total unemployed persons were 14.623 million, decline of 350,000 since last month.
- long-term unemployed (those jobless for 27 weeks and over) statyed flat at a nevertheless intolerable 6.8 million. In June, 45.5% of unemployed persons had been jobless for 27 weeks or more.
- 652,000 people left the labor force in June. This is not a good number, and is exactly the opposite of what we would like to see. As a result, the civilian labor force participation rate decreased by 0.3 percentage points to 64.7 percent.
Here's the breakdown by industry group:
Leisure and hospitality, +28,000.
Professional and business services +21,000.
Temporary help increased again by 21,000. Since December, it has risen by 379,000 since a recent low in September
- This is an excellent.
Transportation and warehousing +15,000 jobs.
Health care employment +9,000.
Mining +6,000
Manufacturing employment +9,000. The industry has added 136,000 jobs since December 2009.
Construction employment decreased by 22,000 in June.
Government employment ex-census actually rose in June by 17,000.
The average workweek decreased by 0.1 hour to 34.1 hours.
The manufacturing workweek for manufacturing employees decreased by 0.5 hour to 40.0 hours.
The average workweek for production and nonsupervisory employees on private nonfarm payrolls was unchanged at 33.4 hours.
Average hourly earnings of all employees in the private nonfarm sector decreased by 2 cents, or 0.1 percent, to $22.53.
Highlights:
I have bolded several of the most important numbers.
Temporary help is a leading indicator for employment, and it continues to increase.
On the other hand, hours in manufacturing declined a full 0.5% of an hour. This is a horrible decrease, and suggests a real slowdown in manufacturing. It is almost certain that the index of Leading Economic Indicators will show a strong decline for June.
State and local government losses surprisingly did not show up this month. Next month of course could be another story.
Construction, the other area of deep contraction, continues to suffer.
There has been a real pulse of deflation in May and June. The leading indicators have gone into a strong decline, at least for this month. This makes it quite likely that in the third or fourth quarter, the economy is going to slow to a stall, and could even shrink. A combination of factors: gas prices at or above $3/gallon earlier this year, Europe's austerity binge, the disaster in the Gulf of Mexico, the "50 little Hoovers" of massive cuts to state and local government budgets, and the collapse of new home sales following the expiration of the $8000 housing credit are all contributing factors. Two of the biggest economic bloggers, Calculated Risk and Barry Ritholtz, so far see a slowdown but do not see the evidence yet for an actual reversal. For me, the decisive factor is housing. The longer the collapse in new home sales continues, the more likely it is that a double-dip occurs (remember that "housing always leads".). Yesterday we also found out that June auto sales were below May's. For the last 4 months, auto sales have stalled between 11.0 and 11.7 vehicles per year. Since auto sales and the price of gasoline are inversely related (the higher the price of gas, the lower the amount of car sales), this is still more pressure on the economy.
For now, there is still (non-census) job growth. I can't help but note that one of our prominent diarists has for several months trumpeted a statement that unemployment would not get below 9.7% this year. That has now been proven wrong.
Finally, a couple of months ago I put together this graph of the real retail YoY growth through March (green), GDP through Q1 2010 (blue), and YoY payroll growth (through March):
Image may be NSFW.
Clik here to view.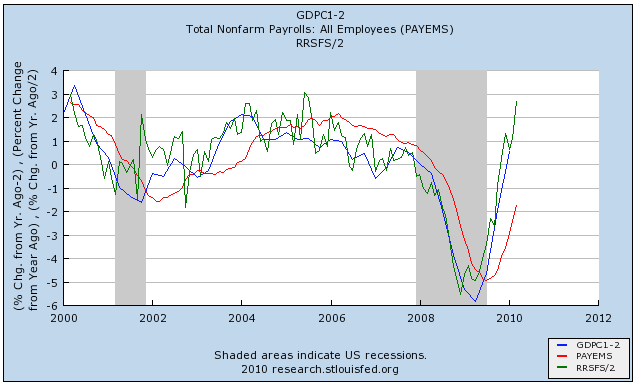 I suggested that this forecasted at some point job growth would be up
by at least 2%.
I suggested that this forecasted at some point job growth would be up
by at least 2%.
Here is that graph updated through yesterday:
Image may be NSFW.
Clik here to view.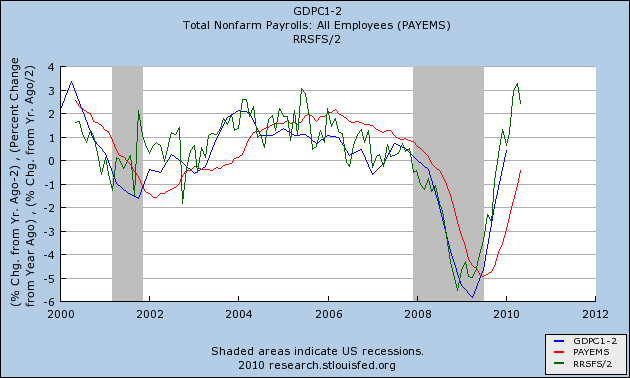
Although we face strong headwinds in the next few months, the trendline is still intact, so I'm crossing my fingers and hoping for good news.
Whether or not you agree with me, I wish everyone here a very happy and safe Fourth of July Weekend. Let us celebrate another year of living in the most successful Republic for the last 2000 years.